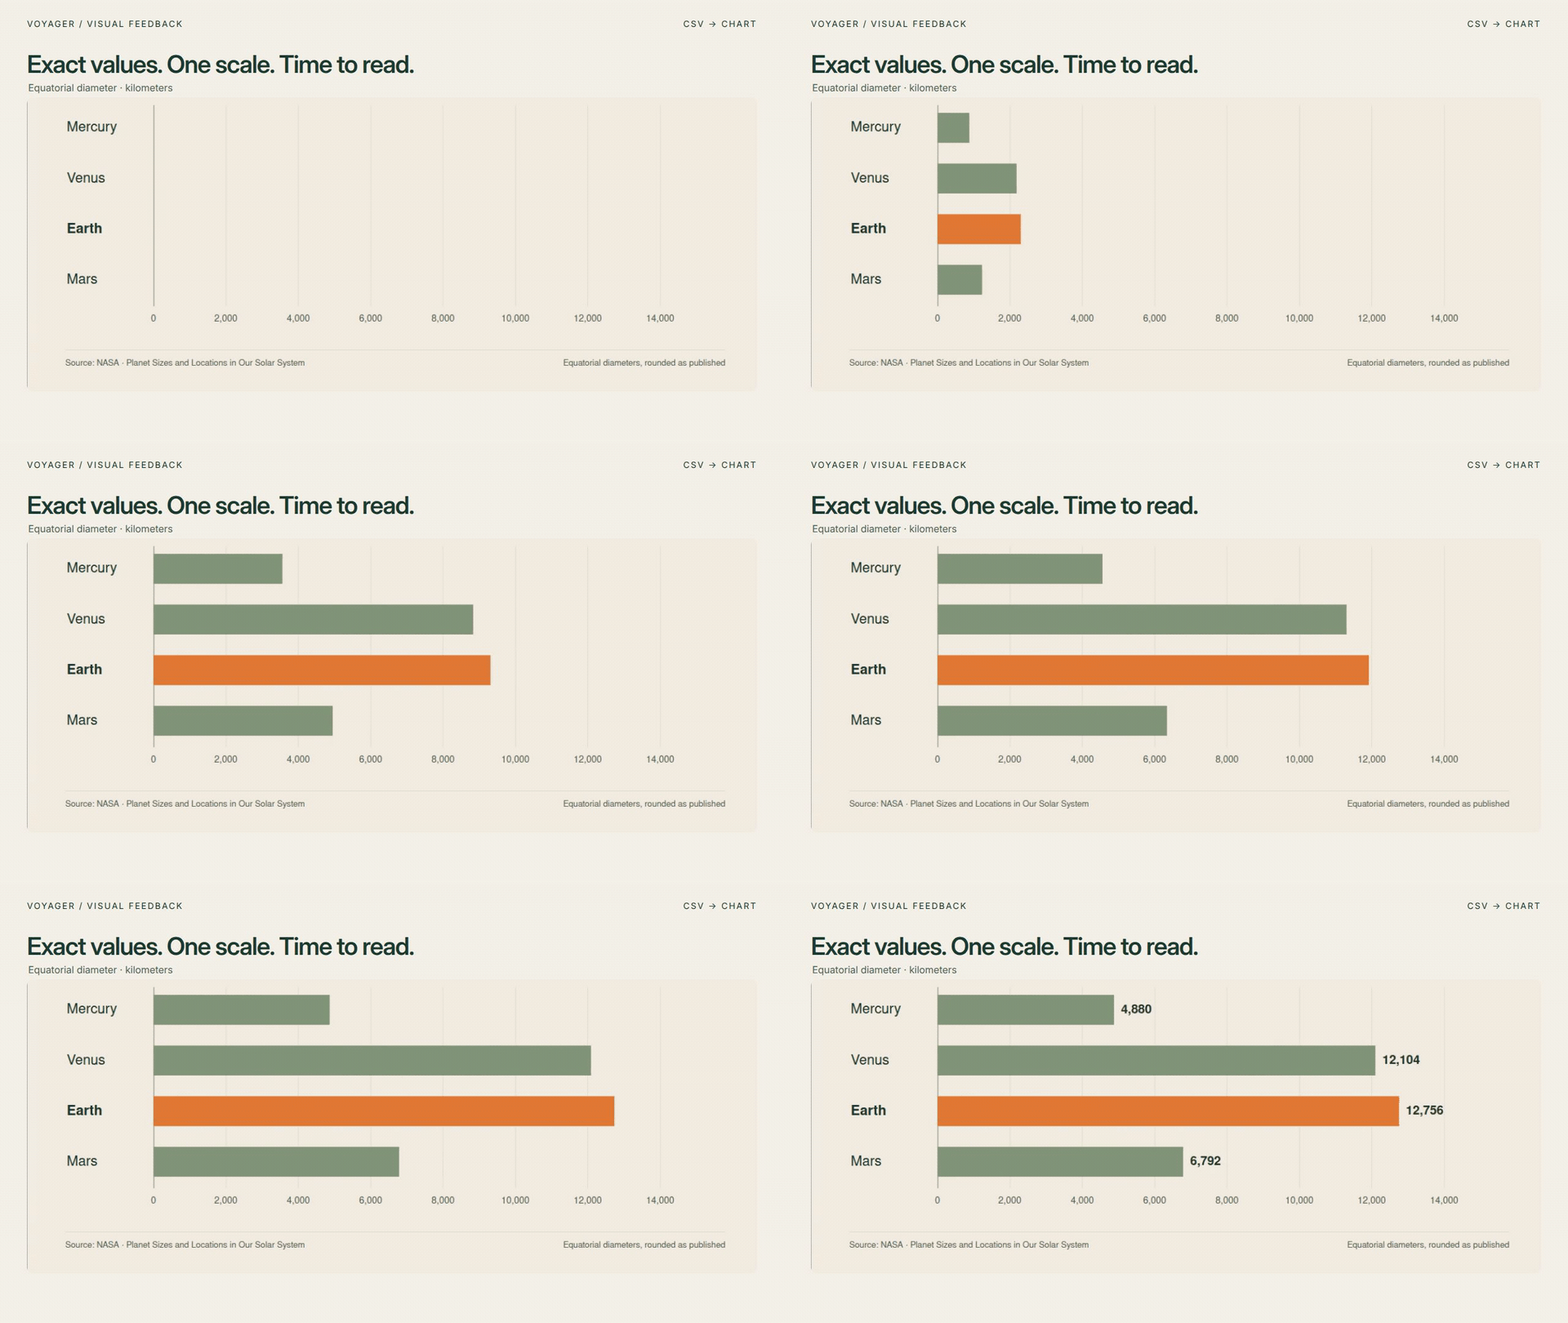
A useful chart video does two things: preserves the numbers and gives viewers time to understand the comparison. That makes it useful in a social explainer, a presentation or a monthly update.
Coding agents can now build these animations with Remotion; its prompt showcase includes rankings, timelines and data charts. Here’s a prompt you can reuse, what to check, and how Voyager takes the revision further with feedback pinned directly to the video.
Start with this prompt
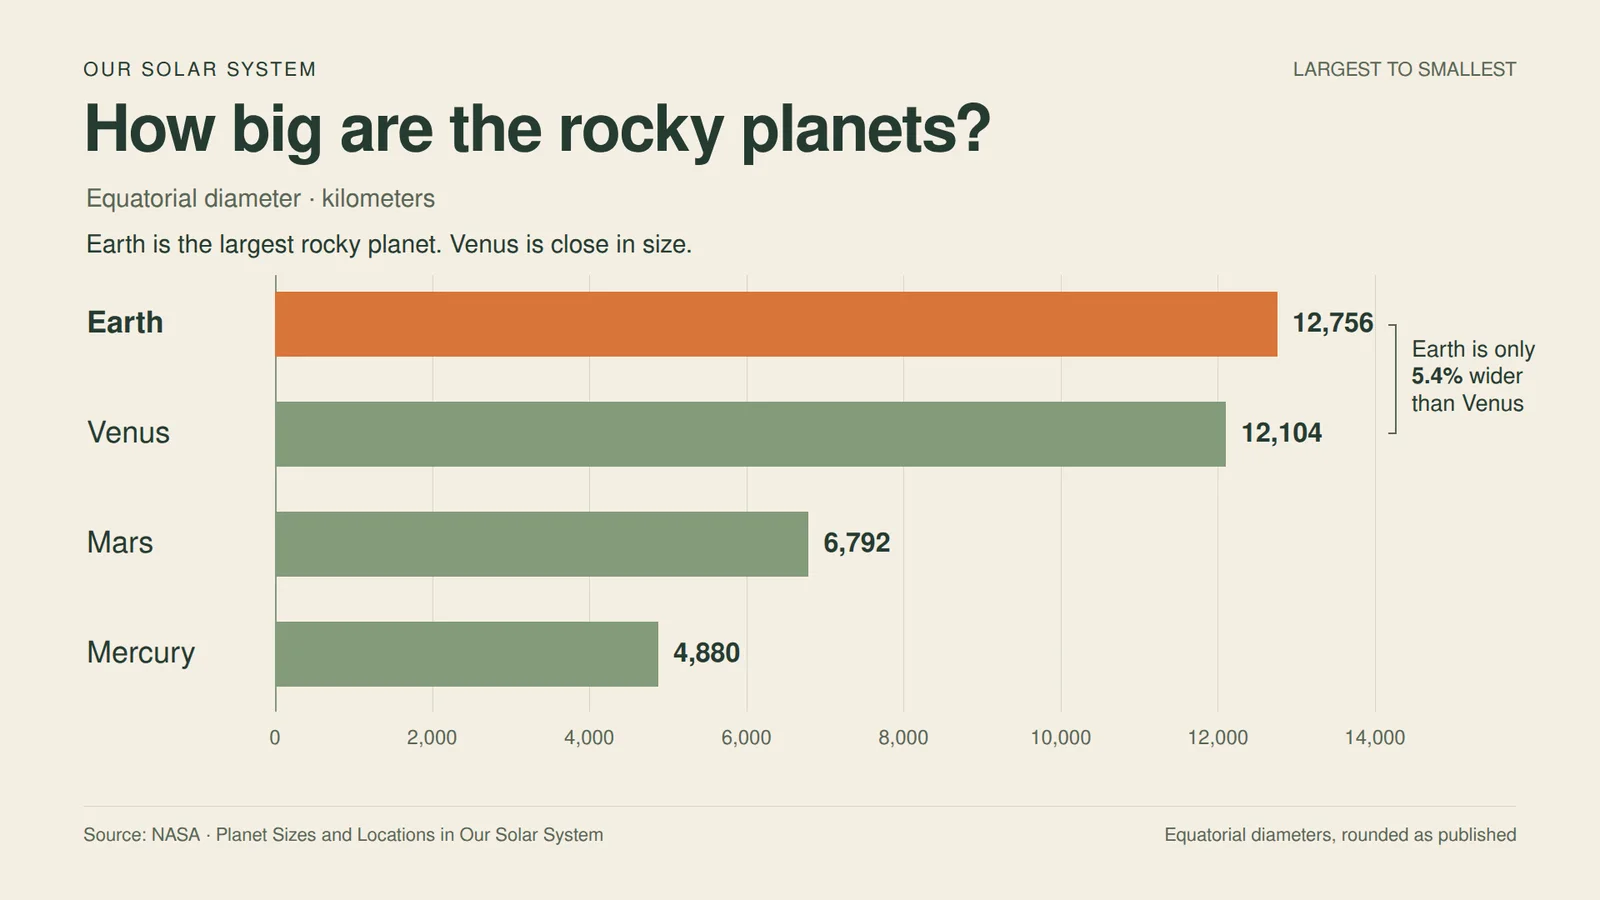
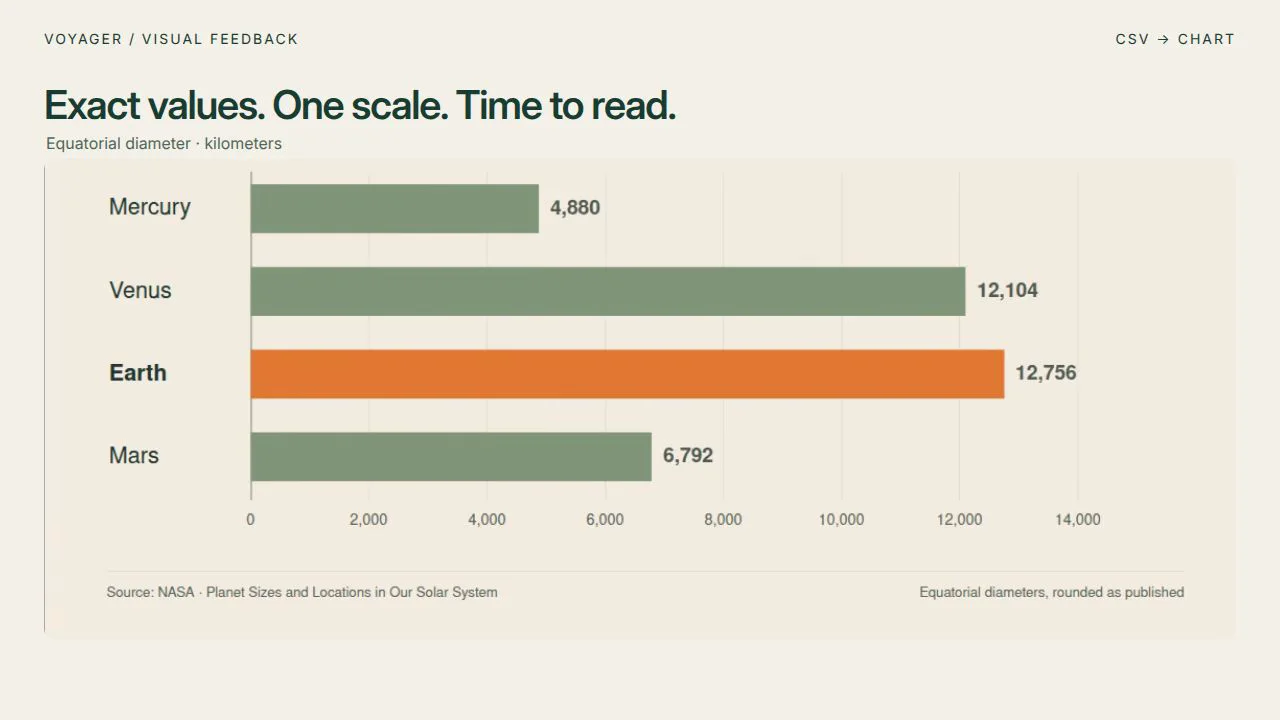
Give a Remotion-capable agent planets.csv and a SOURCE.md containing NASA’s source link. Our four values are equatorial diameters in kilometers: Mercury 4,880, Venus 12,104, Earth 12,756, Mars 6,792.
Use planets.csv to make a 12-second animated chart titled “How big are the rocky planets?” Use Remotion at 1920×1080. Keep the CSV unchanged and display its exact equatorial diameters in kilometers on a shared zero-to-14,000 scale. Order the planets from largest to smallest. Use a warm paper background, sage bars and an orange highlight for Earth. Reveal the bars together without overshoot, then hold the complete chart for at least four seconds. Credit NASA using SOURCE.md. Show a preview and keep the editable source.
This is a reusable version of the brief from our run, combining the initial prompt and a later sorting revision. It works outside Voyager with an agent that can set up and run Remotion.
Check the comparison before exporting
Three constraints do most of the work:
- One zero baseline. Bar lengths should encode the values honestly.
- No overshoot. A growing bar should never imply a larger measurement.
- A reading hold. Leave the completed chart onscreen long enough to compare it.
Check labels against the CSV and inspect the final frame. Our initial preview followed orbital order; sorting by size made the comparison easier to read. The numbers stayed unchanged.
Export the revised chart as a 1080p MP4. Keep the CSV, editable source, font and dependency lockfile with the project.
Download the editable project to adapt it to your own data. This project uses a derived data.json; ask your agent to update it when the CSV changes. Remotion needs an initial setup and has its own license terms.
Take it further in Voyager: point to the change
Earth and Venus look almost equal. A small annotation could make that relationship explicit. In Voyager, open the video in Files, pause after the bars settle and pin a comment beside Venus:
Make this comparison explicit: add “Earth is only 5.4% wider than Venus” beside these two bars, appearing after they finish growing. Calculate the percentage from the CSV. Keep every value, bar length, scale and the 12-second duration unchanged. Update the editable source and export a new MP4; preserve the previous version.
Description / transcript
Pause at 7.03 seconds and pin a comment beside Venus. Send the attached review. The agent adds the calculated 5.4 percent comparison, updates the source and exports a new video. The previous export remains available.
Attach the review to the conversation and send it. Voyager carries the comment’s time and position with the video reference. You can give visual direction while keeping the source project and conversation together, without preparing a separate screenshot and timecode note.
The agent added the callout, updated the source and exported a new MP4 while preserving the previous version. Our comment was pinned at 7.03 seconds. The calculation is (12,756 − 12,104) ÷ 12,104 × 100 = 5.386…%, rounded to 5.4%.
Make your next project in Voyager
Create an account, download Voyager, and start making.